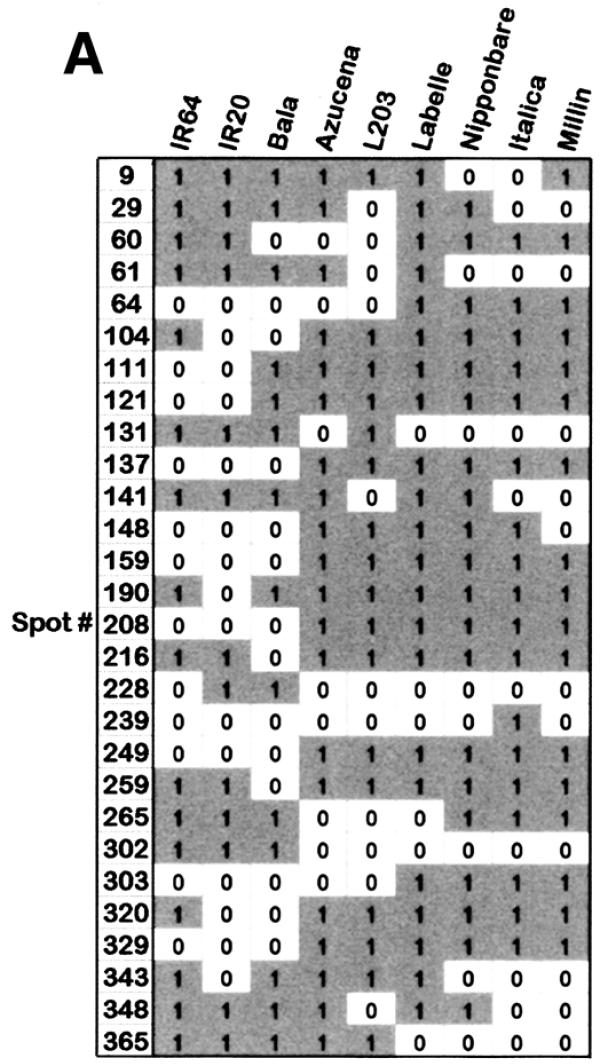
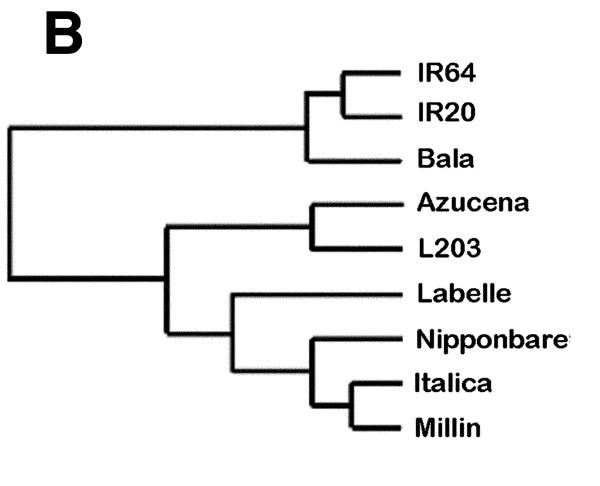
Figure 5.

Genetic variation detected on the MspI Diversity Panel among nine rice cultivars. (A) A table of binary scores for cultivars analysed at polymorphic spots. Each cultivar was analysed with two slides, but since all replicates were classified as being the same, only one score per spot is presented for each cultivar. (B) Dendrogram generated from the MspI Diversity Panel. The binary scoring table of 28 unique features from the MspI panel was analysed by Cluster program (Stanford) using similarity metric setting of correlation uncentered and presented by treeview (Stanford). Differentiation among the cultivars analysed and separation between japonica- and indica-types is apparent in the dendrogram.

