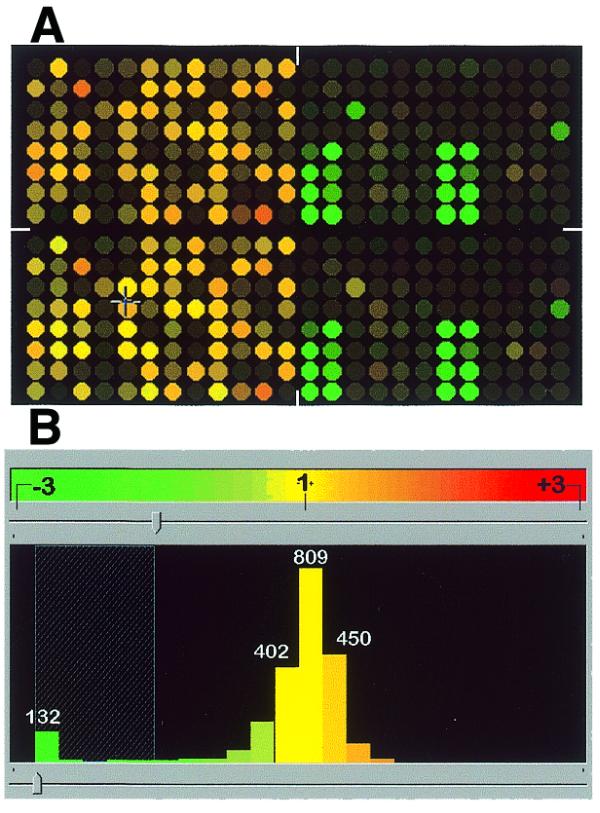
Figure 6.

A reconstruction experiment using mixed (rice and several microorganisms) Diversity panels. ‘Clean’ Millin representation was labelled with red fluorescent dye and Enterobacter ’contaminated’ Millin representation was labelled with green fluorescent dye. The synthetic image and histogram were created using Pathways. (A) The left half of the array (mostly yellow features) represents the rice MspI panel. The right half of the array contains features from MspI panels from seven bacterial species and one from yeast. Green spots in the right part of the array correspond to the elements of the panel developed from the same Enterobacter DNA source as the one ‘spiked’ into Millin DNA. (B) Histogram of the signal ratios for the array presented in (A). The Enterobacter spike is detected as the ‘green’ left tail of the distribution.
