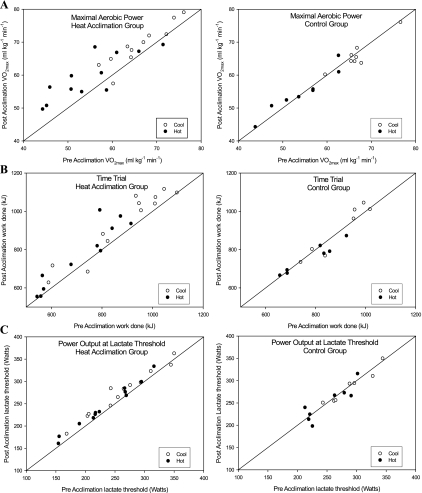
Fig. 1.
Individual data for relationship between pre- and postacclimation in performance variables of heat acclimation (left) and control (right) groups under hot and cool condition. A: maximal aerobic power (V̇o2max). B: time trial performance. C: lactate threshold. Straight line represents line of equality.

