
FIGURE 1.
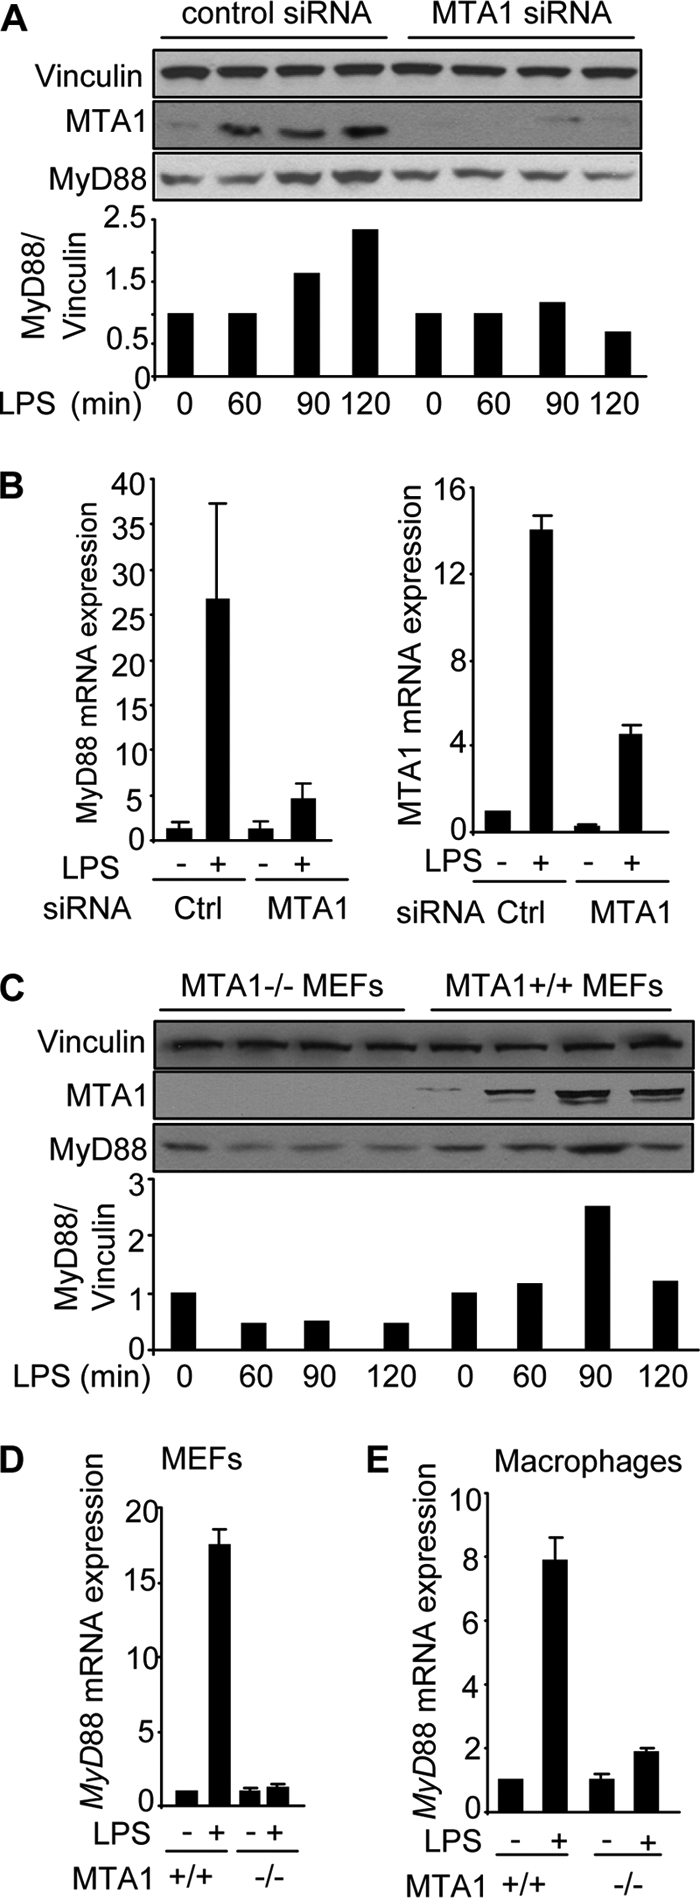
MTA1 regulates MyD88 expression. A, upper, Western blot analysis of MyD88 in LPS-stimulated Raw cells with or without MTA1 knockdown. Lower, densitometric analysis of MyD88 protein expression. B, qPCR analysis of MyD88 mRNA in LPS-stimulated Raw cells with or without MTA1 knockdown. C, upper, expression of MyD88 protein in LPS stimulation of MTA1+/+ and MTA1−/− MEFs. Lower, densitometric analysis of MyD88 expression. D, qPCR analysis of MyD88 mRNA in LPS-stimulated wild type and MTA1−/− MEFs. E, qPCR analysis of MyD88 mRNA in LPS-stimulated murine macrophages isolated from wild type and MTA1−/− mice.