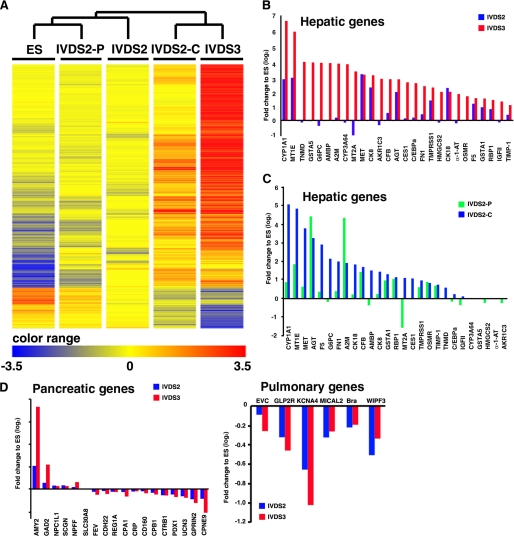
FIGURE 3.
Microarray analysis of the spatial and temporal global gene expression pattern in differentiated monkey ES induced by hESdF co-culturing. A, hierarchical clustering of ESCs and cells of IVDS2, IVDS2-P, IVDS2-C, and IVDS3 according to genes that were highly differentially expressed (>10-fold change) between ESCs and IVDS3 differentiated cells as highlighted by heat map. B and C, differential expression (>2-fold change) of genes known to be highly expressed in the liver by UniGene transcriptome cluster annotation were used to analyze the expression biases of cells of IVDS2 and IVDS3 (B) or IVDS2-P and IVDS2-C (C). D, genes known to be highly expressed in the pancreas and lung by UniGene transcriptome cluster annotation were used to analyze the expression biases of cells of IVDS2 and IVDS3 (B).

