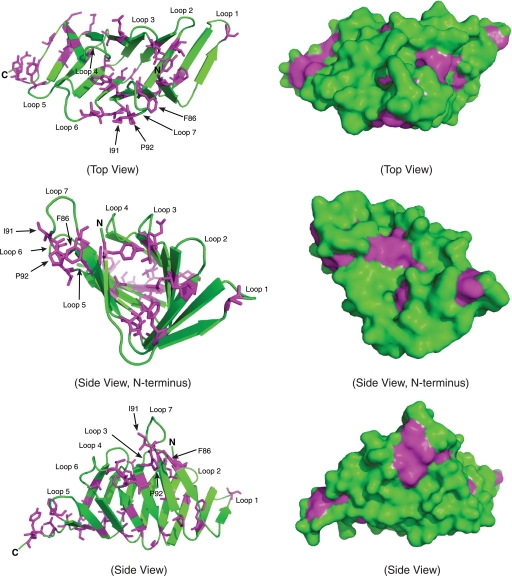
FIGURE 7.
Ribbon diagrams and surface representations of the conserved hydrophobic residues of LptC. The magenta and green colors represent the highly conserved hydrophobic residues and non-conserved residues of LptC, respectively. Hydrophobic residues in the core, as well as loop 7, could potentially adopt different conformations to accommodate LPS binding.

