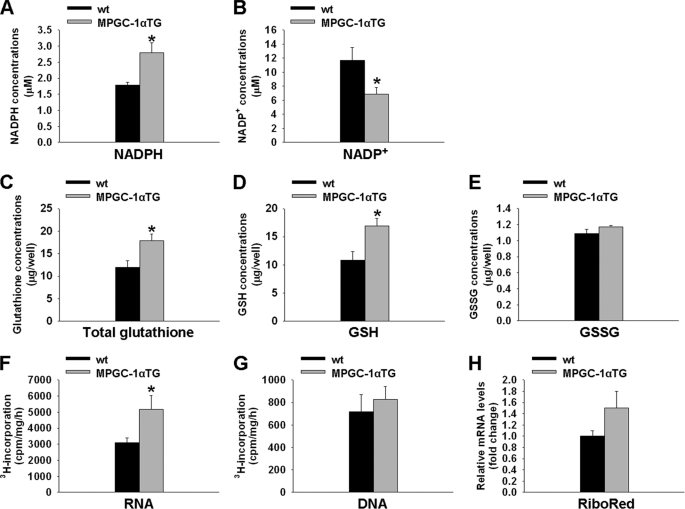
FIGURE 4.
Increased pentose phosphate pathway products in MPGC-1α TG mice. A and B, concentrations of NADPH and NADP+, respectively, in glycolytic muscle of MPGC-1α TG mice versus control mice. C–E, amounts of total, reduced (GSH), and oxidized (GSSG) glutathione, respectively, extracted from glycolytic muscle. F and G, incorporation of tritium-labeled glucose into RNA and DNA, respectively, in EDL muscle of MPGC-1α TG and control mice. H, determination of ribonucleotide reductase (RiboRed) mRNA levels. All values are means ± S.E. (n = 6–8/group). *, p < 0.05.

