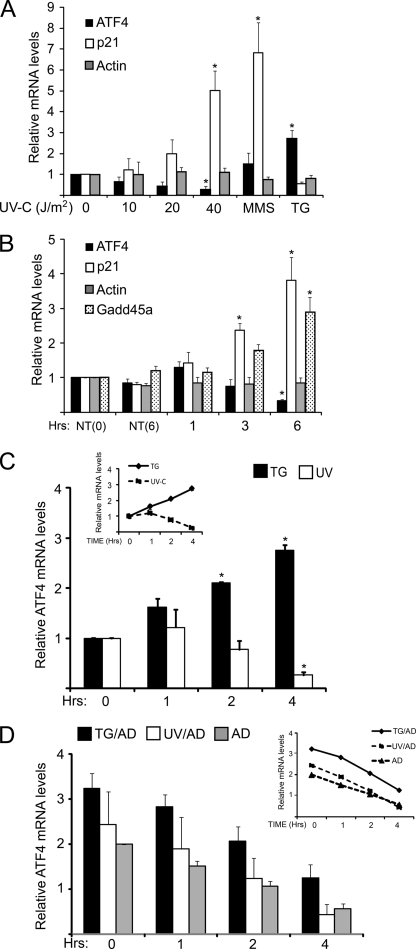
FIGURE 4.
Levels of ATF4 mRNA are reduced in response to UV irradiation. A, MEF cells were treated with the indicated doses of UV-C irradiation and subsequently incubated in the culture medium for 6 h. Alternatively cells were treated with either 100 μm MMS or 1 μm TG for 6 h. Total RNA was isolated from the samples, and the levels of ATF4, p21, and β-actin mRNAs were measured by qRT-PCR. Values were plotted as -fold change compared with the no treatment control (0). B, MEF cells were treated with 40 J/m2 UV-C and then incubated in the culture medium for up to 6 h as indicated. NT (0) indicates cells not treated with UV-C, and NT (6) indicates a mock-treated cell preparation that was followed by a 6-h incubation period. Transcript levels were measured by qRT-PCR for ATF4, p21, GADD45a, and β-actin as indicated. C, levels of ATF4 mRNA were measured in MEF cells treated with 40 J/m2 UV-C irradiation and then incubated in culture medium for 1, 2, or 4 h as indicated. Cells not subjected to stress are indicated as 0. Additionally, ATF4 transcript levels were measured in cells that were exposed to 1 μm TG for up to 4 h. D, measurement of the half-life of ATF4 mRNA was carried out by first treating MEF cells with 1 μm TG or to 40 J/m2 UV-C UV. 1 h later the cells were then treated with 20 μm actinomycin D (UV+AD or TG+AD) to halt transcription and then cultured for up to 4 h. Alternatively, cells were treated with actinomycin D alone (AD). ATF4 mRNA levels were measured by qRT-PCR at the indicated times, and the panels are presented as the averages ± S.D. of three independent experiments, with each measurement performed in triplicate (*, p < 0.05).

