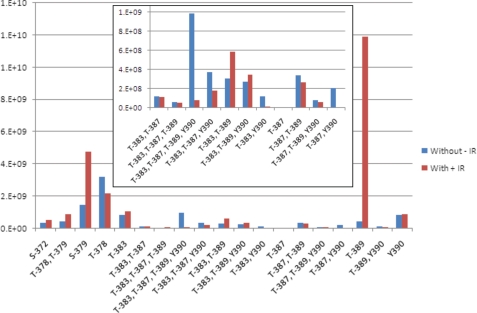
FIGURE 2.
Quantitative changes in phosphoryl-species in response to IR. The relative changes in the amounts of each observed peptide phosphoryl-species in response to ionizing radiation were calculated using quantitative multiple reaction monitoring mass spectrometry. The normalized ion counts for each species are indicated in the y axis graph. The target phosphoryl-species is indicated on the x axis. The value associated with each species before exposure to IR is indicated in blue (without −IR) and the values associated with the same species after exposure is indicated in red (with +IR). The inset contains an expansion of the y axis for those phosphoryl-species displaying lower values.

