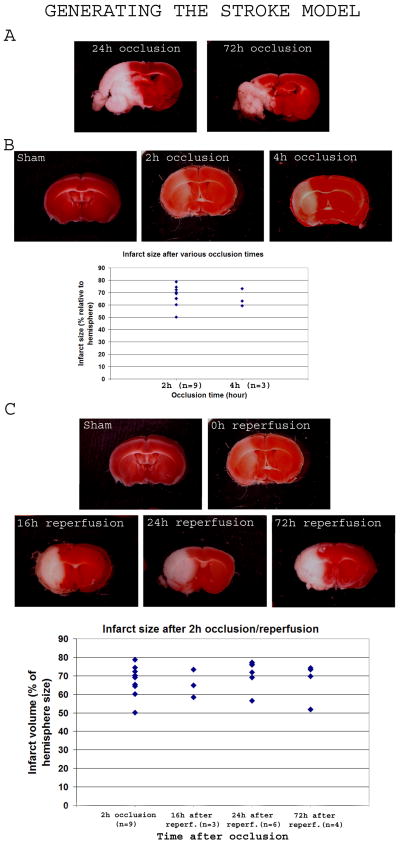
FIGURE 1. Generating the stroke model.
Brains of control mice and mice subjected to stroke were sectioned and stained with 2, 3, 5 triphenyl tetrazolium chroride (TTC) to detect the infarct area. Intact tissue stained red while infarcted tissue appears white.
1A-After permanent occlusion, TTC-stained brains after 24h and 72h of MCAO revealed a major infarct area occupying most of the hemisphere, and liquefying at 72h.
1B-Permanent occlusion of only 2h or 4h resulted in a clear infarct, more severe with a longer occlusion time, and respectively occupying 69.7 ±6.5% and 65.2 ±7.1% of the ipsilateral hemisphere as shown in the histogram.
1C-Mice were subjected to 2h MCAO followed by reperfusion and TTC staining at variable times afterwards (16h, 24h, 72h). The infarct area appeared a mix of white and pink in color just after 2h. Overtime, the color became fully white in the affected area suggesting complete death of the tissue in the affected area. The scatter graphic shows a comparative quantification of the infarct size just after 2h occlusion (left bar), then at various times after reperfusion of a 2h-occlusion MCAO (16h, 24h and 72h after reperfusion, respectively second, third and fourth cluster).

