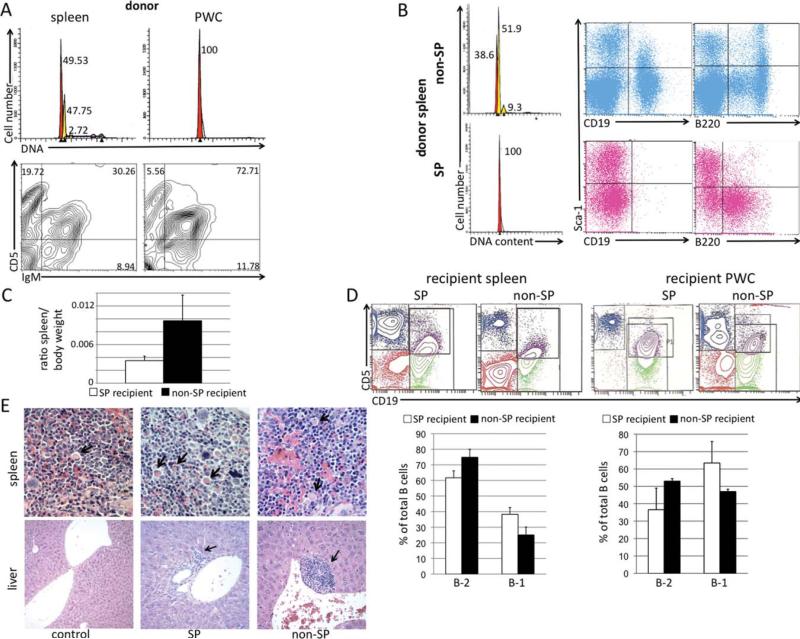
Fig. 6.
In vivo transfer of NZB SP and non-SP. A, Top row: hypotonic PI analysis of DNA content of spleen (left panel) and PWC (right panel) of 13mo NZB donor. Peaks represent cells in G1, with spleen having a diploid G1 peak (red) and a dominant hyperdiploid peak (yellow). Bottom row: Flow cytometric analysis of 13mo NZB donor spleen (left) and PWC (right) stained with antibodies against IgM and CD5. Percentage of each cell type of lymphoid gate is indicated in the quadrant. B, The spleen from the 13 month NZB donor was sorted into SP and non-SP. Right panel: DNA analysis of sorted non-SP (top) and SP (bottom) from donor NZB showing G1 hyperdiploidy present only in the non-SP population. SP and non-SP cells from the donor NZB were also analyzed via flow cytometry for expression of CD19, B220, and sca-1. C, Ratio of spleen to body weight at time of sacrifice. White column = ratio of NZB injected with SP and black = ratio of NZB injected with non-SP. Error bars represent SEM, 3 mice/group. D, Top row: Representative flow cytometric analysis of spleens and PWC from NZB recipients injected with SP or non-SP sorted cells. Bottom row: B-2 (CD19+ CD5− ) and B-1 (CD19+ CD5dim) cells are shown as a percentage of total B cells from spleen (left) and PWC (right) of NZB recipients injected with SP (white bars) or non-SP (black bars). Error bars are SEM, three mice per group. E, Representative histological analysis of spleen (top row) and liver (bottom row) from control, SP, and non-SP recipient mice stained with hematoxylin and eosin, (×40 for spleen, ×10 for the control liver, and ×20 for experimental liver with foci). Arrows in spleen indicate presence of Mott cells, and arrows in liver sections indicate lymphocyte foci.

