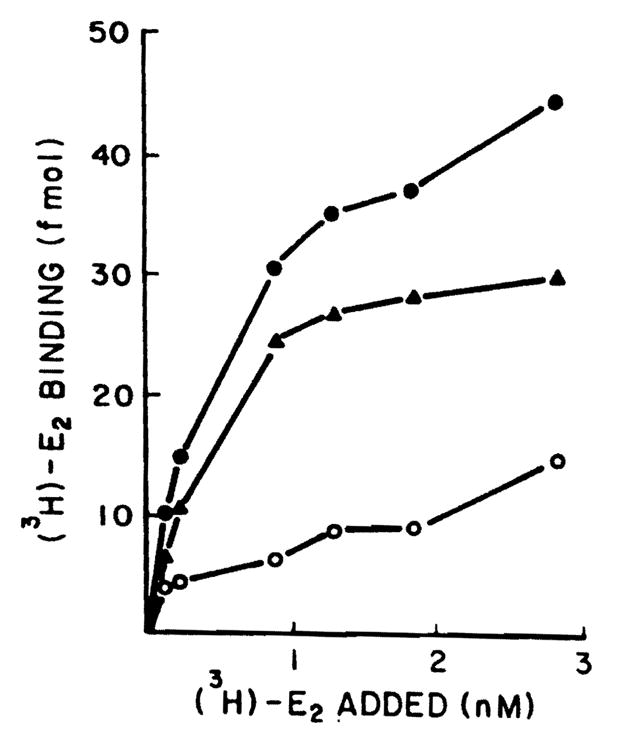
Figure 1.

Specific binding of the [3H]E2 by cytosol of the normal male rat liver. Aliquots (200 μm) of whole cytosol (5 mg/ml) precipitated with protamine sulfate were incubated with six different concentrations of [3H]E2 (0.15–3 nM) for 18 h at 0°C in the presence and absence of 100-fold unlabeled E2. Specific binding was calculated by subtracting nonspecific binding from total binding. Each point is the average of triplicate determinations. Closed circles represent total binding, open circles nonspecific binding, triangles specific binding.
