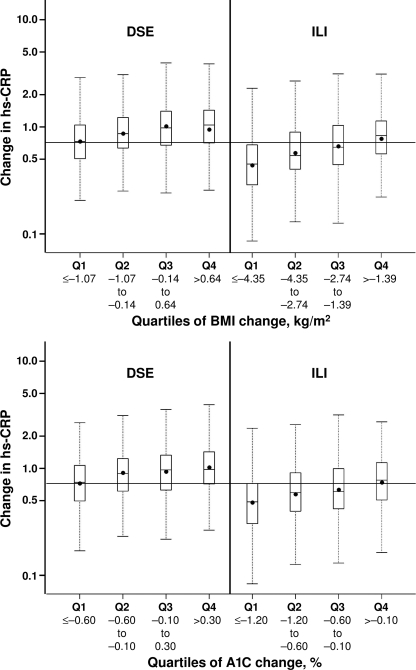
Figure 1.
Change in hs-CRP (median and IQR) at 1 year in the DSE arm vs. the ILI arm by quartiles (Q) of change in BMI (top) and A1C (bottom). Change in hs-CRP is a proportional change, with numbers <1.0 indicating a decrease in hs-CRP and those >1.0 an increase in hs-CRP and the horizontal line representing overall mean change. Q1 denotes the greatest reduction in BMI and A1C, respectively.

