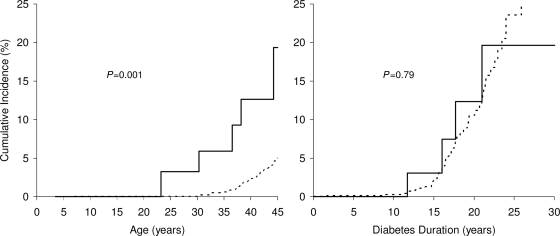
Figure 1.
Cumulative incidence of diabetic ESRD by age (left) and by duration of diabetes (right) according to exposure to diabetes in utero (——, exposed; – – –, unexposed). The five cases of ESRD in the exposed group result in five steps in the cumulative incidence plot by age. Only four cases are shown in the cumulative incidence plot by duration, because the fifth case occurred at a duration beyond the range of the figure.

