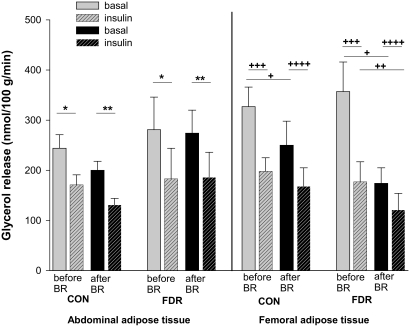
FIG. 2.
SCAAT and SCFAT lipolysis in the basal state (no pattern) and the insulin-stimulated state (patterned) before (gray) and after (black) bed rest (BR) in CON and FDR of type 2 diabetic subjects. *Basal vs. insulin-stimulated state before bed rest in CON (P = 0.01) and FDR (P = 0.006). **Basal vs. insulin-stimulated state after BR in CON (P = 0.0009) and FDR (P = 0.004). +Basal state before vs. after BR in CON (P = 0.02) and in FDR (P = 0.0006). ++Insulin-stimulated state before vs. after BR in FDR (P = 0.009). +++Basal vs. insulin-stimulated state before BR in CON (P = 0.0001) and in FDR (P = 0.0004). ++++Basal vs. insulin-stimulated state after BR in CON (P = 0.02) and in FDR (P = 0.02).

