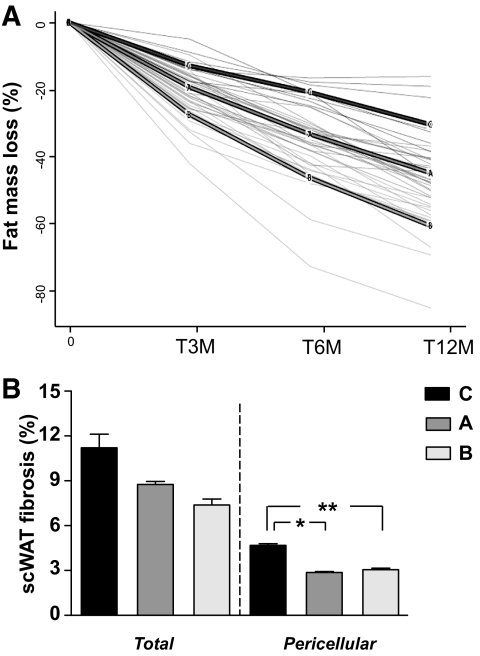
FIG. 5.
Clustering of fat mass loss profiles in obese subjects and relation with scWAT fibrosis. A: Individual fat mass changes at 3, 6, and 12 months after surgery were clustered using a recently implemented k-means algorithm dedicated to longitudinal data. The panel shows individual fat mass changes expressed as change at 3, 6, or 12 month/time 0 values. Three clusters were built. A, B, and C are the mean of fat-mass changes in each clustered group. B: Mean of scWAT total fibrosis or pericellular fibrosis in each clustered group, A, B, and C. Pericellular fibrosis is significantly more abundant in cluster C compared with A and B. *P = 0.01 **P = 0.001.

