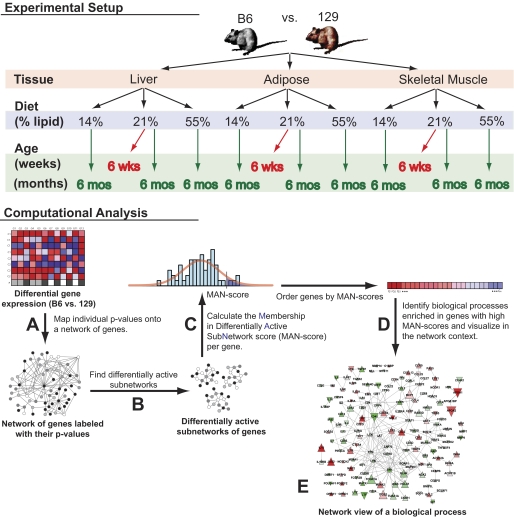
FIG. 1.
Overview of gene network enrichment analysis. Individual comparisons of B6 and 129 mice were performed in different tissue types (adipose, skeletal muscle, and liver), ages (6 weeks and 6 months), and diets (high fat, low fat, and standard chow). A: For each comparison, a differential expression significance value was determined for each gene, converted to a z score, and mapped onto a network of protein-protein interactions. The colors in the network represent the different ranges of z scores. B: A stochastic search algorithm (18) was then applied to search for subnetworks with high mean z score (high significance). Each application of the algorithm identifies one subnetwork; hence, to detect a multitude of subnetworks, the algorithm was run many times. The consensus among these subnetworks represented approximations of the true, differentially active network in B6 vs. 129 mice. C: A membership in differentially active subnetwork (MAN) score was determined for each gene. MAN scores are P values and represent the probability of genes to belong to the true, differentially active network. This score was calculated as the random chance probability that the gene is detected in the observed number of subnetworks computed over permutations of the data. D: Biological processes and pathways were tested for enrichment in genes with high MAN scores. Statistically significant pathways and processes were predicted to be differentially active in B6 vs. 129 mice. E: For each significant process and pathway, a network visualization was generated to aid interpretation.

