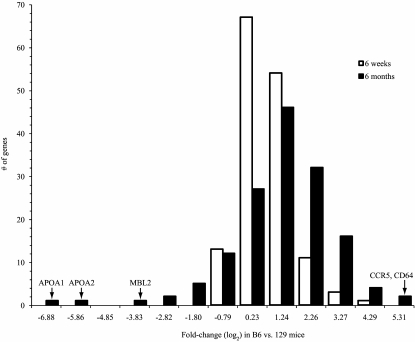
FIG. 2.
Histogram of differential expression between B6 and 129 mice at 6 weeks and 6 months of age for genes in the immune system process network. The x-axis values are the upper bounds of the histogram bins and correspond to the log2 fold-change difference in B6 vs. 129 mice. Few network genes are unchanged (absolute log2 fold change <1) in B6 vs. 129 mice at 6 months. The majority are strongly upregulated (log2 fold change ≥1), although a few are strongly downregulated (log2 fold change ≤ −1). A network view of the same biological process demonstrating the fold changes of individual genes is provided in supplementary Fig. S2.

