FIG. 3.
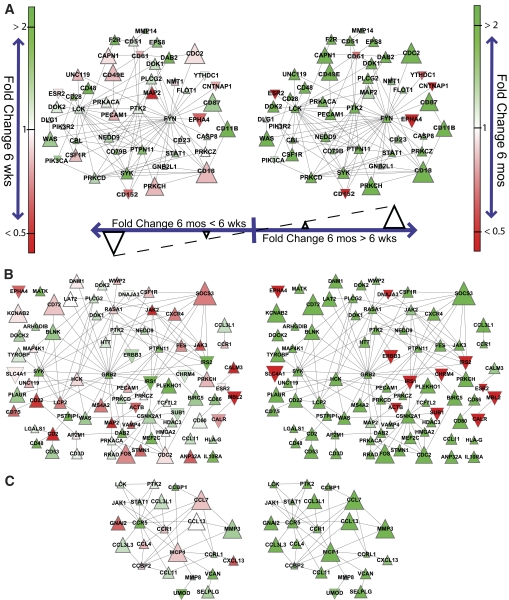
Gene networks associated with inflammatory markers in adipose tissue of B6 and 129 mice at 6 weeks (left) and 6 months (right) of age. Gene networks were generated by mapping genes that were significantly overrepresented (Q value < 0.25) among the gene network enrichment analysis results at 6 months intersected with those at 6 weeks onto protein-protein interaction networks involving at least one interactor to each inflammatory marker: (A) Thy1, (B) CD45, and (C) MCP1. The CD45 network was further restricted only to genes showing a greater than twofold magnitude difference in B6 vs. 129 mice between 6 weeks and 6 months. This was done to aid visualization since the unrestricted network consisted of 416 interactions and 141 genes. Colors range from bright red to green, corresponding to twofold less and twofold greater differences in expression between B6 and 129 at each age, respectively. Nodes point upward if the fold-change difference between B6 and 129 is greater at 6 months than at 6 weeks, and downward otherwise. The node size corresponds to the magnitude of that fold-change difference between the two ages. The inflammatory network around each biomarker is drawn to scale between the two ages. Networks around different biomarkers are not to scale with one another.

