FIG. 6.
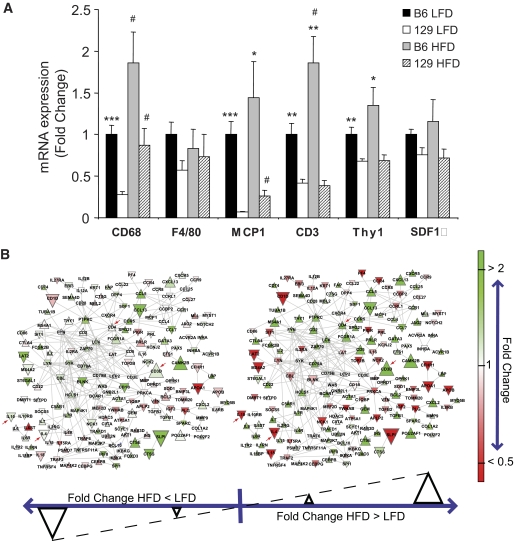
Expression of inflammatory markers in adipose tissue of 6-month-old B6 and 129 mice fed with LFD or HFD. A: Expression of mRNA was assessed by qPCR. All values are normalized by TBP and expressed as fold change of the average value of the LFD B6 mice. Results represent mean ± SEM of 4–6 animals. *P < 0.05; **P < 0.01; ***P < 0.001 vs. 129 mice. #P < 0.05 vs. LFD. B: The network view of the immune system process differences between B6 and 129 mouse strains on a LFD (left) and HFD (right). The gene network was generated by mapping genes that were significantly overrepresented in B6 vs. 129 mice (Q value <0.25) among the GNEA results on HFD intersected with those on LFD onto protein-protein interaction networks involving genes annotated with the immune system process gene set. Genes in red are more than twofold higher in 129 mice compared with B6 mice; genes in green are more than twofold higher in B6 mice compared with 129 mice. Genes are denoted by a downward triangle if the fold change of the HFD animals is less than those on the LFD, and by an upward triangle for the converse; the size of the triangle denotes the magnitude of the difference. Arrows represent genes with specific interest commented on in the main text.

