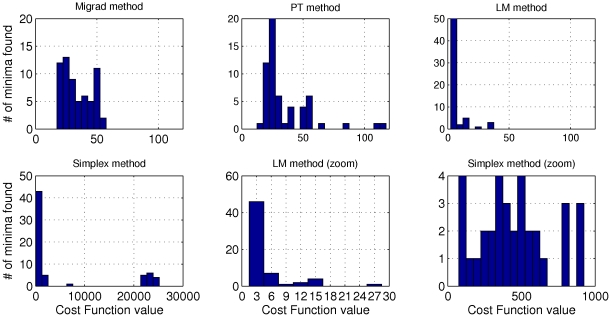
Figure 2. Histograms of the minima of the cost function obtained using different optimization methods.
In all cases, runs started from a fixed 6-dimensional mesh of 64 points, in which each parameter was evaluated at 2 values. The optimization methods were launched and run until convergence, and the minimum obtained in each run was recorded to create these histograms.

