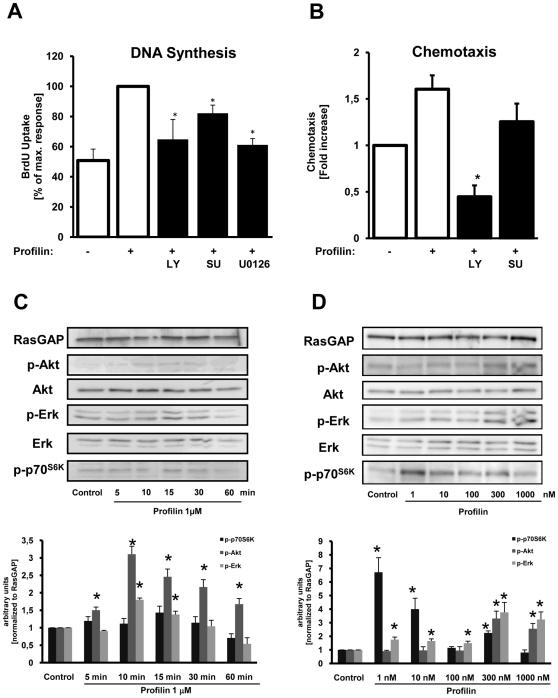
Figure 4. Profilin induces cellular responses and activates classical signaling cascades in human coronary VSMCs.
(A) DNA-synthesis as assessed by measurement of BrdU incorporation in the absence or presence of inhibitors as indicated. Data are expressed as the percentage of the maximal profilin-response. (B) Chemotaxis was evaluated utilizing modified Boyden chemotaxis chambers in the absence or presence of inhibitors as indicated. Data are expressed as fold increase compared to buffer-treated control cells. See Figure 3 for inhibitors. Data in A and B represent means ± SEM from at least three independent experiments. *P<0.05, **P<0.01 vs. control. (C and D) Quiescent VSMCs were stimulated with recombinant profilin-1 (1 µM) for various time points and at various concentrations as indicated. The cells were lysed, and equal amounts of protein were subjected to SDS-PAGE and Western blot analyses, using phospho-specific antibodies recognizing phosphorylated p70S6K, Akt, and Erk1/2. RasGAP served as a lysate control. Data in C and D were quantified by densitometry and are expressed as fold increase compared to buffer-treated control cells.

