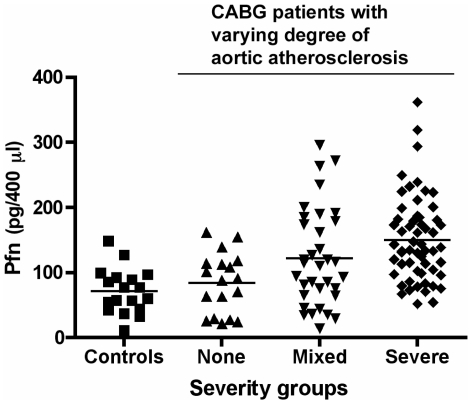
Figure 6. Correlation between the degree of aortic atherosclerosis and profilin-1 serum levels.
In 104 patients undergoing CABG, the degree of aortic atherosclerosis was assessed by intraoperative ultrasound at 33 points along the arch, thoracic and abdominal aorta. According to the 33-point ultrasound score, individuals were clustered into three categories (0–7 = None; 8–20 = Mixed; 21–33 = Severe). The control group is represented by 18 individuals without major diagnosed diseases. Shown is a dot plot, the bar representing the mean in each group. p<0.001 between the ‘Severe’ group and the ‘Control’ or ‘None’ group.

