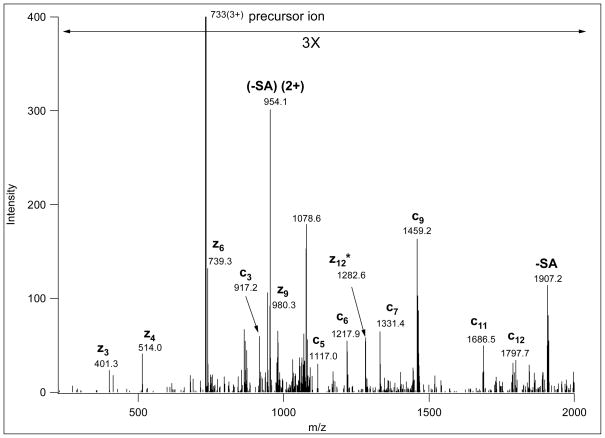
Figure 2.
ETD spectrum of m/z 733.0369(3+), corresponding to AAT(GalNAcGalSA)LSTLAGQPLLER. This spectrum provides sufficient information for confident sequence identification as well as site assignment. Sialic acid loss from charge-reduced versions of the precursor ion was also detected. Fragments labeled with asterisk indicate hydrogen transfer, i.e. z+1 ions.

