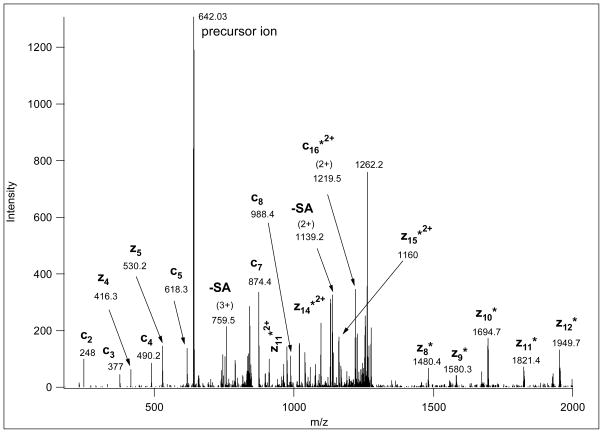
Figure 3.
This ETD spectrum of m/z 642.03 (4+) was manually deciphered as representing the Na-adduct of TEELQQQNTAPT(GalNAcGalSA)NSPTK. CID and ETD data for the same glycopeptide from a protonated ion of a lower charge state are shown in Figure 1. Its MS spectrum is presented in Figure 4, where the upper panel clearly illustrates that at the higher charge state the solely protonated ion was practically non-existent. Asterisk-labeled fragments retained the Na-ion.

