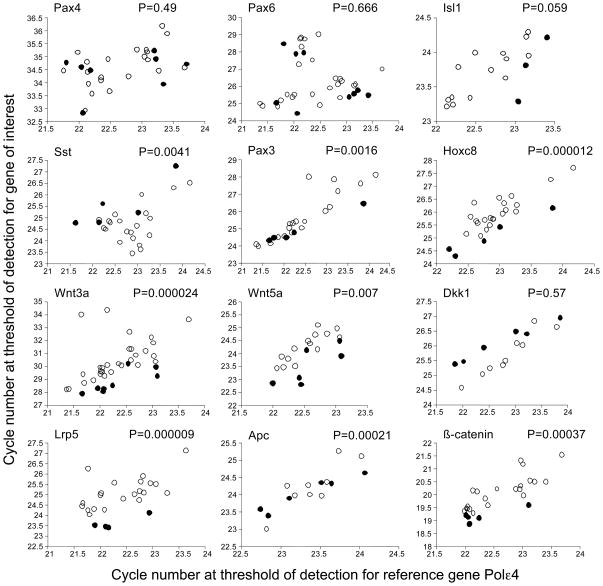
Figure 2. Expression of selected developmental control and Wnt pathway genes in diabetes-exposed embryos.
Expression levels were measured by quantitative Real-Time PCR in relation to the expression levels of the reference gene Polymerase Σ 4 in the same samples. Samples were from independent diabetes-exposed embryos without overt developmental defects, and control samples were pools of 4–5 embryos from normal pregnancies. Each open circle represents an individual diabetes-exposed embryo; each closed circle represents a measurements for a control sample. Greater values on the axes reflect lower levels of expression; hence, data points towards the top of each graph represent lower expression of the gene of interest, data points towards the bottom of each graph represent higher expression levels. For the majority of genes where a statistically significantly different distribution of data points was observed (P-values from two-tailed t-tests are noted) between diabetes-exposed and control embryos, expression levels are reduced under conditions of maternal diabetes; the exception is Sst, whose expression levels are increased in diabetes-exposed embryos. Expression levels were normalized to expression levels of PolΣ4 for calculation of the fold magnitude of change (see text).

