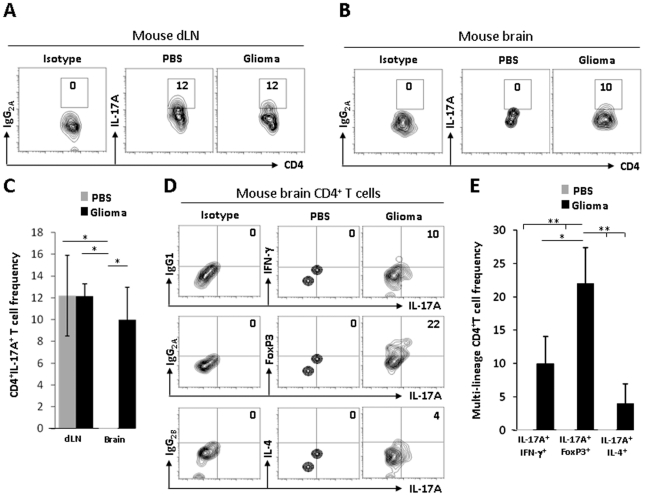
Figure 3. Th17 cell phenotype in dLN and mouse brain with or without a GL261 cell injection.
(A) Analysis of draining lymph nodes for CD4+IgG2A+ (isotype control) or CD4+IL-17A+ cells in mice that received an intracranial (IC) injection of PBS or 4×10⁵ GL261 cells (Glioma). (B) Analysis of brains for CD4+IgG2A+ (isotype control) or CD4+IL-17A+ cells in mice that received an IC injection of PBS or 4×10⁵ GL261 cells (Glioma). (C) Average CD4+IL-17A+ cell frequency in dLNs or brains (±SEM). (D) Analysis of brains for CD4+IL-17A+IgG1+ (isotype control) or CD4+IL-17A+IFN-γ+ cells (1st row), CD4+IL-17A+IgG2A + (isotype control) or CD4+IL-17A+FoxP3+ cells (2nd row) and CD4+IL-17A+IgG2B + (isotype control) or CD4+IL-17A+IL-4+ cells (4th row) in mice that received an intracranial injection of PBS or 4×10⁵ GL261 cells (Glioma). (E) Average CD4+IL-17A+IFN-γ+, CD4+IL-17A+FoxP3+, and CD4+IL-17A+IL-4+ cell frequency in brains (±SEM). Data are representative of at least 2 independent experiments. * and ** denotes significant differences at p≤0.05 and p≤0.01, respectively.

