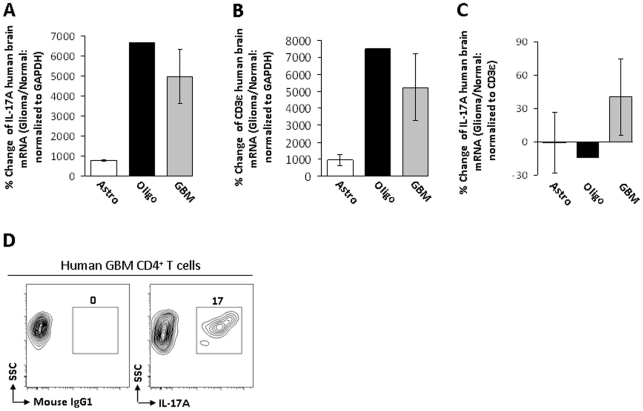
Figure 4. Th17-related mRNA expression levels and Th17 cells in human glioma.
(A) IL-17A mRNA levels are displayed as the percent change between the glioma group (Glioma) and normal human brain (Normal), normalized to GAPDH. (B) CD3ε mRNA levels are displayed as the percent change between the glioma groups (Glioma), astrocytoma (grade 2; Astro), oligodendroglioma (grade 3; Oligo), glioblastoma multiforme (GBM) and normal human brain (Normal), normalized to GAPDH. (C) IL-17A mRNA levels are displayed as the percent change between the glioma groups (Glioma), astrocytoma (grade 2; Astro), oligodendroglioma (grade 3; Oligo), glioblastoma multiforme (GBM) and normal human brain (Normal), normalized to CD3ε. (D) Analysis of GBM for CD4+IgG1+ (isotype control) or CD4+IL-17A+ cells. Flow cytometry data are representative of at least 2 independent GBM patient specimens. Bar heights represent means (±SEM).

