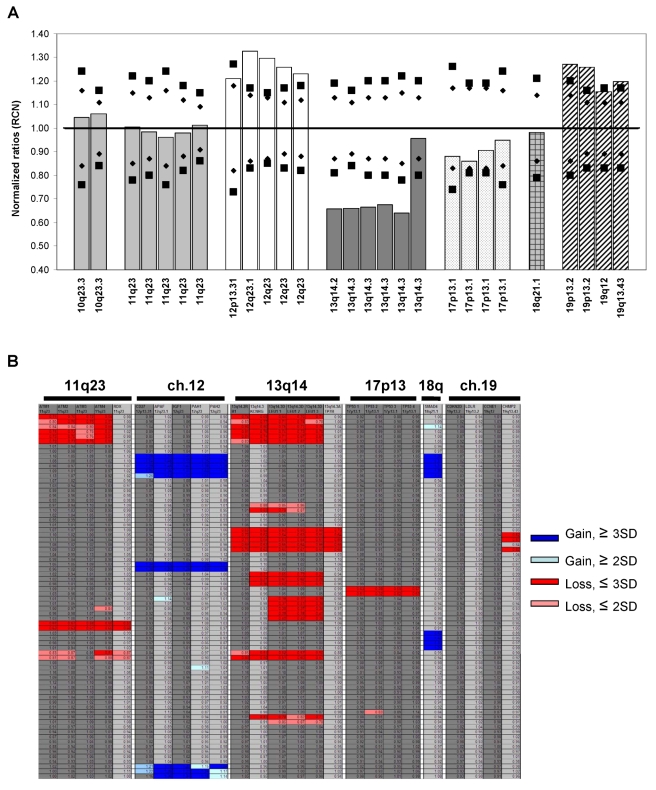
Figure 1. Representative MLPA analysis on CLL patients.
(a) Normalized ratio plot (relative copy number, RCN) from a CLL patient with trisomy 12 and 19, and 13q14 deletions. The data were normalized to those of normal controls. The reference ranges of 2 SD (Mean ± 2SD, 95% CI, P = 0.05) and 3 SD (Mean ± 3SD, 99% CI, P = 0.01) for each probe are shown by diamonds and squares, respectively. (b) MLPA analysis of copy number changes on multiple CLL samples are called and highlighted on a heatmap as blue (gain, ≥3SD), light blue (gain, ≥2SD), red (loss, ≤3SD) and pink (loss, ≤2SD) blocks that lie outside of reference ranges of each probe. Note that the high resolution of MLPA in several 13q- and 11q- cases can pinpoint deletion region down to a single gene level.

