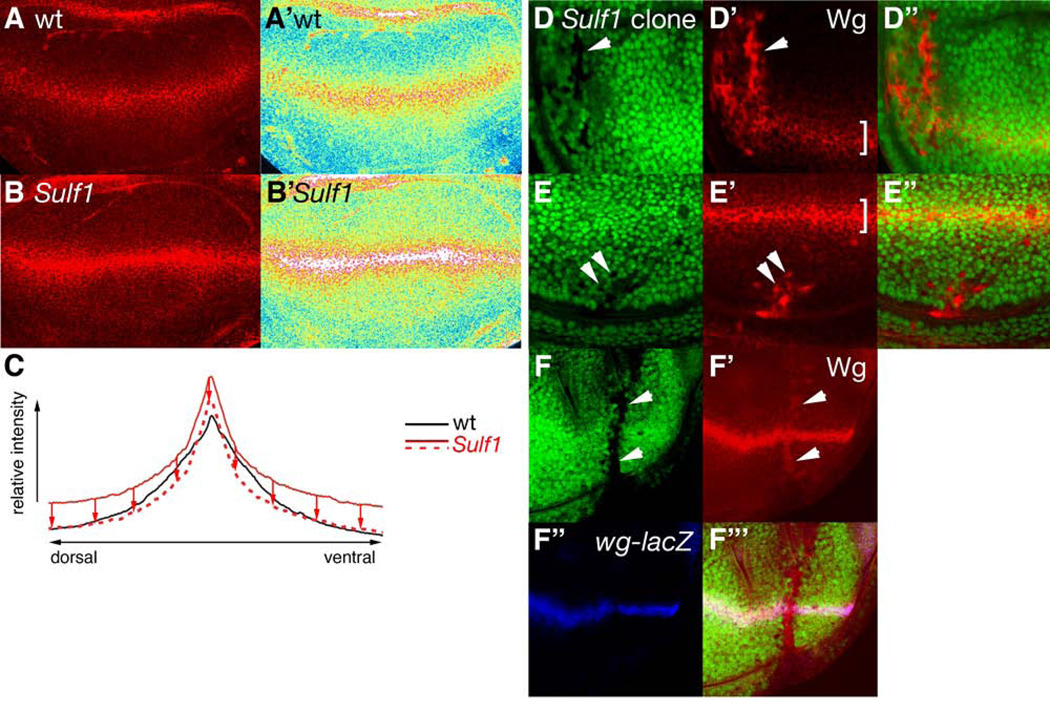
Figure 4. The level of extracellular Wg protein is elevated in Sulf1 mutant wing discs.
(A-B’) Immuno-staining for extracellular Wg protein in wild-type (A and A’) and Sulf1 (B and B’) discs. Signal intensity in A and B is shown in pseudocolor to compare intensity in A’ and B’, respectively. Pseudocolor scale ranges from white (highest signal intensity) to dark blue (lowest signal intensity). Note the higher intensity levels of Wg protein throughout the wing disc as a whole in the Sulf1 homozygous mutant. (C) Signal intensity of extracellular Wg was obtained from raw confocal images by Image J software. Intensity plots were generated by averaging intensity values for wild-type (continuous black line, n=29) and Sulf1 (continuous red line, n=18) wing discs. For a more direct comparison of gradient shape, a downward translation of the Sulf1 plot (red arrows/dashed red line) was transposed directly on top of wild-type. Sulf1 wing discs exhibited a steeper gradient of Wg signal intensity when compared to wild-type. (D-E”) Two examples are shown for the effect of small Sulf1 mutant clones on the distribution of extracellular Wg. GFP signal and extracellular staining of Wg are shown in green (D and E) and red (D’ and E’), respectively. D” and E” show merged images. Abnormally high levels of Wg protein accumulate in small Sulf1 clones (arrowheads). The brackets indicate the extracellular Wg signal located at the DV border. (F-F”’) A wing disc with small Sulf1 clones stained with anti-β-gal antibody to mark wg-lacZ expression. GFP signal, extracellular staining of Wg, and wg-lacZ are shown in green (F), red (F’), and blue (F”), respectively. F”’ shows a merged image of F, F’, and F”. wg-lacZ is not induced in small clones in which extracellular Wg protein accumulates (arrowheads).

