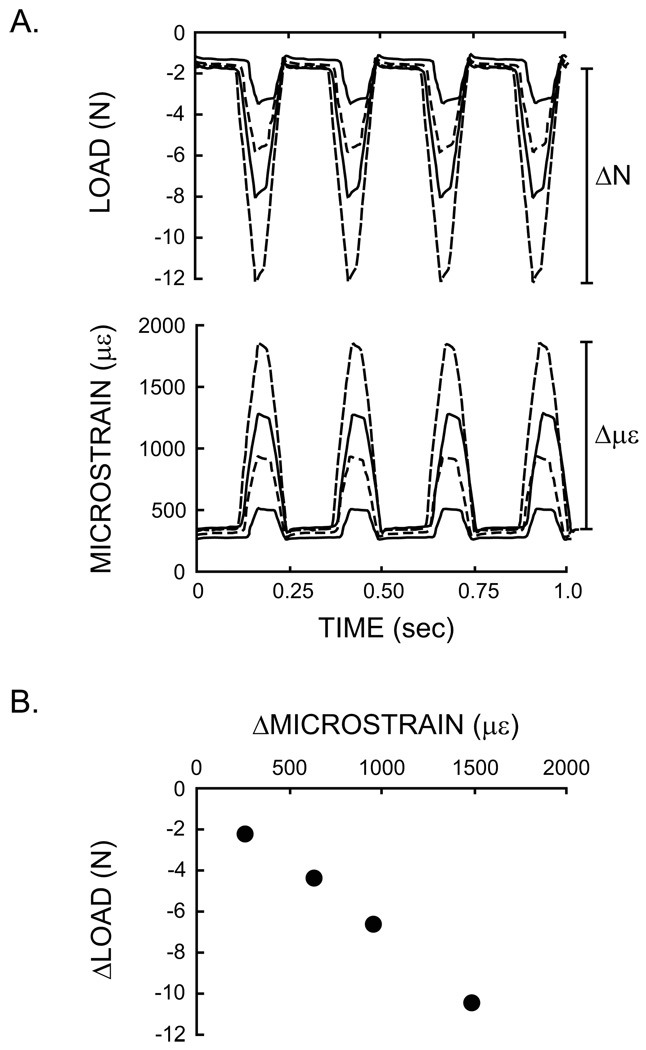
Figure 2.
Measurement of tibial stiffness. (A) Sample data from four successively greater peak loads applied cyclically to the tibia and the corresponding tibial deformation recorded by the strain gauge. (B) Stiffness was determined as the change in load (ΔN) over the change in strain (Δμε) during each load cycle. This relationship was linear with increasing load. Each point plotted is a mean of four load cycles. Mean stiffness for each tibia was taken as the average of the four stiffness values plotted in (B).

