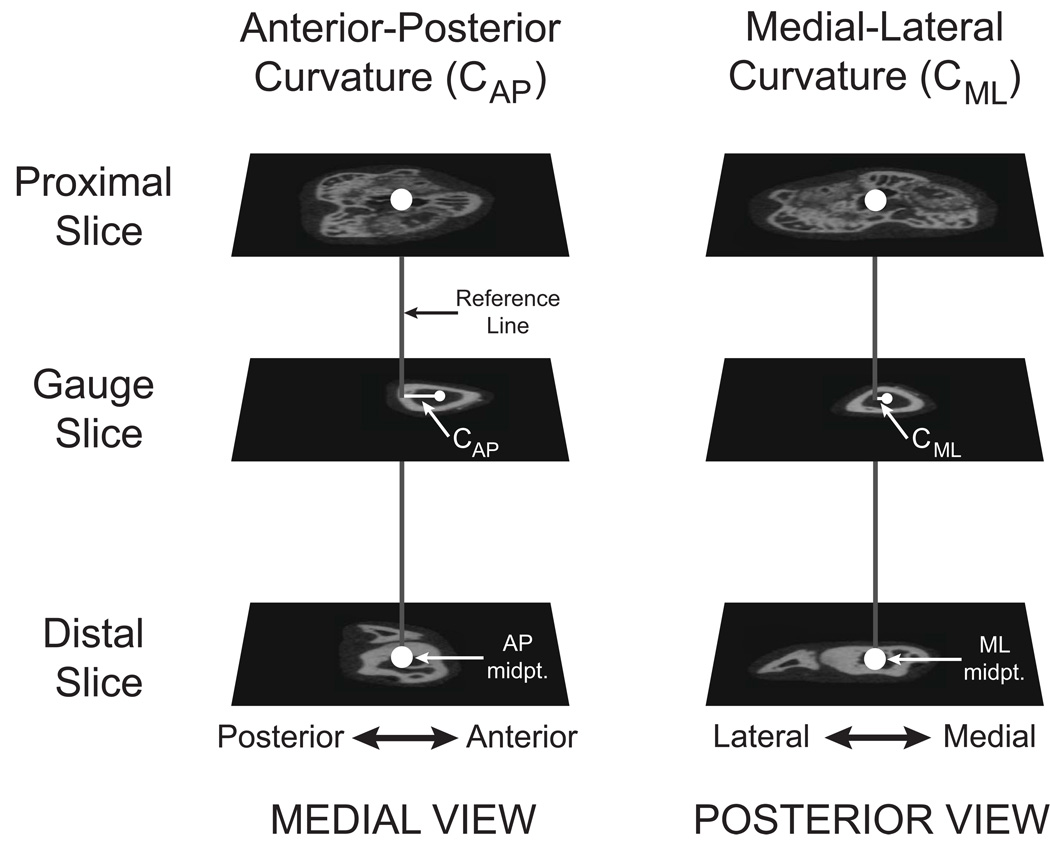
Figure 3.
Measurement of tibial longitudinal bone curvature. The anterior-posterior and medial-lateral longitudinal bone curvatures (CAP and CML) were measured using transverse slices from the whole bone microCT scans. A reference line (gray) was created between the AP and ML midpoints in the proximal and distal slices (large white circles). The AP and ML midpoints at the mid-gauge slice (small white circles) were determined and the perpendicular distances between these and the reference lines measured in the AP and ML directions (CAP and CML). This figure shows the anterior and smaller medial convexities commonly measured for the mouse tibiae in this study.

