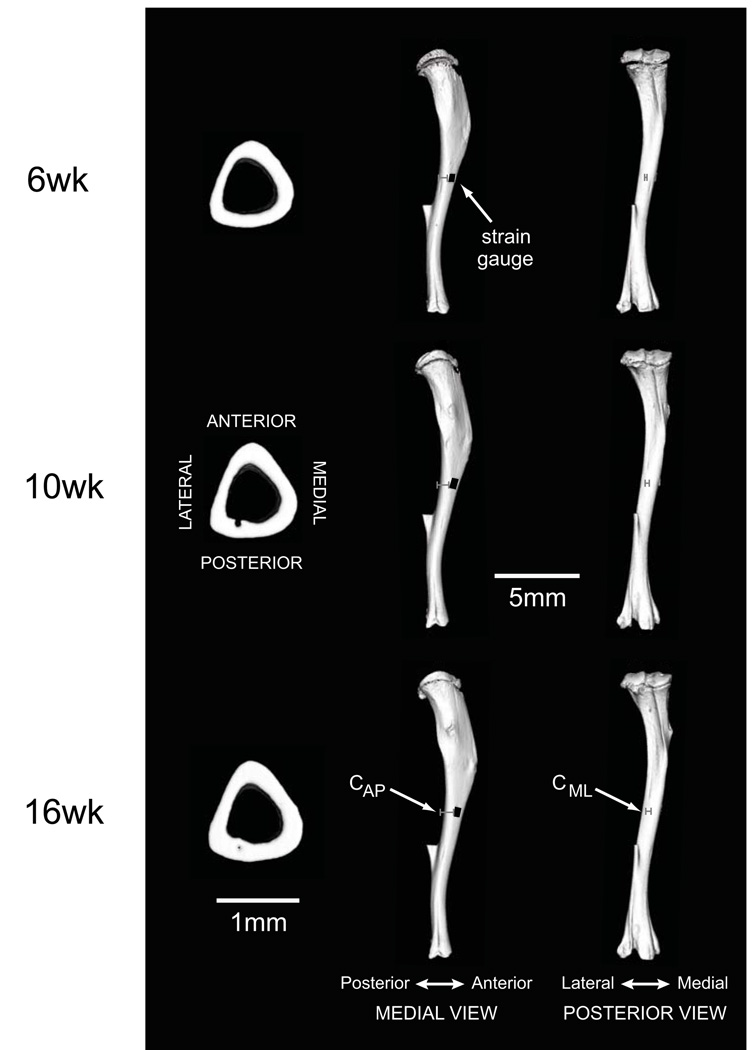
Figure 4.
Tibial morphology during growth and development. Three-dimensional cross-sectional and whole bone reconstructions from microCT scans illustrate developmental changes in diaphyseal and whole bone morphology. Medial and posterior views of the tibiae illustrate representative measures for CAP and CML, respectively, in the three age groups (gray bars). Representative strain gauge positions on the anterior-medial aspects of the tibial diaphyses are indicated in black in the medial view. The fibulae were also scanned, but were excluded from analysis during processing of the microCT scans.

