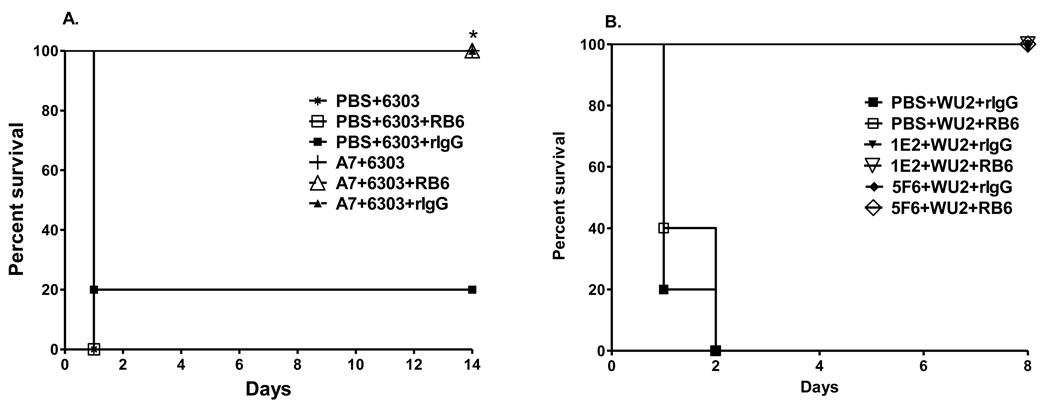
Figure 4. Survival after i.p. infection with (A) 30 CFU ST3 (6303) and (B) 100 CFU ST3 (WU2), comparing neutrophil- depleted and neutrophil-sufficient mice.
The percent of PBS-, A7, 5F6 and 1E2-treated mice surviving after i.p. infection at the times designated on the x-axis is depicted. Closed symbols represent rIgG-treated mice; open symbols represent RB6-treated mice. *p<0.05 between groups for the designated treatments; Kaplan-Meier log rank survival test. N=5 mice per group.

