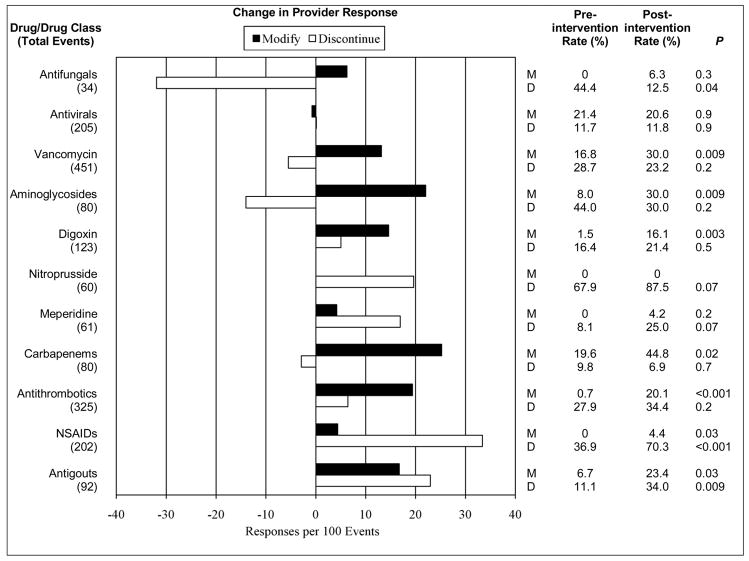
Figure 4. Change in Rate of Drug Modification or Discontinuation by Individual Drug or by Drug Class.
Response rates represent the proportion of eligible medication orders modified (M) or discontinued (D) within 24 hours of an increase in serum creatinine following an order for a target nephrotoxic or renally cleared drug. Drugs or drug classes with fewer than 10 increasing serum creatinine events were excluded.

