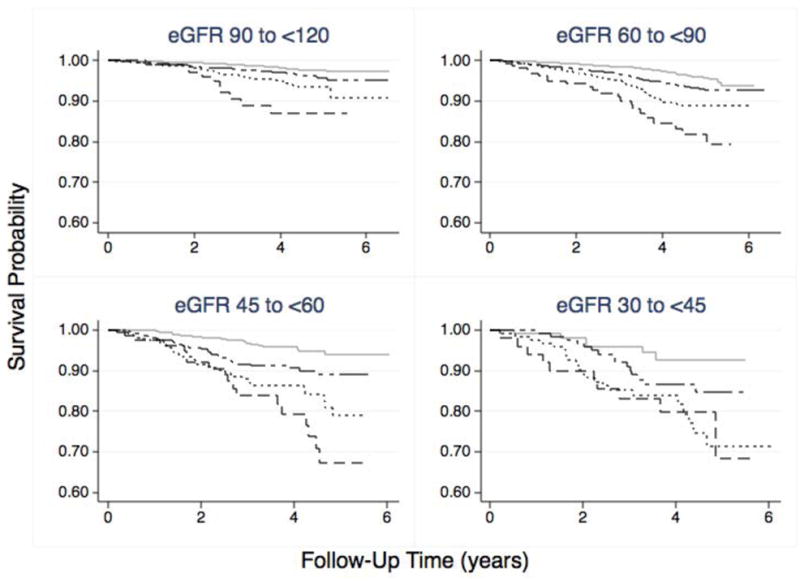
Figure 2. Survival Plots for 17,393REGARDS Participants: All-Cause Mortality Stratified by Urinary Albumin/Creatinine Ratio (ACR), within estimated Glomerular Filtration Rate (eGFR) Categories.

The survival probability curves were obtained by Kaplan-Meier analysis. The solid gray lines represent the survival probabilities for participants with Normal ACR (<10 mg/g). The long-short dashed lines represent participants with High Normal ACR (10 to <30 mg/g), the dotted lines represent participants with High ACR (30 to 300 mg/g) and the dashed lines represent survival probability for participants with Very High ACR (>300 mg/g). The eGFR categories were defined at the baseline evaluation, and the follow-up time was the difference between initial enrollment date and date of confirmed death. There were 710 deaths over an average follow up of 3.6 years. The log rank tests were significant (<0.001) for the entire cohort, as well as each of the ACR categories in each eGFR strata. The numbers at risk for each category are shown below the figure.
