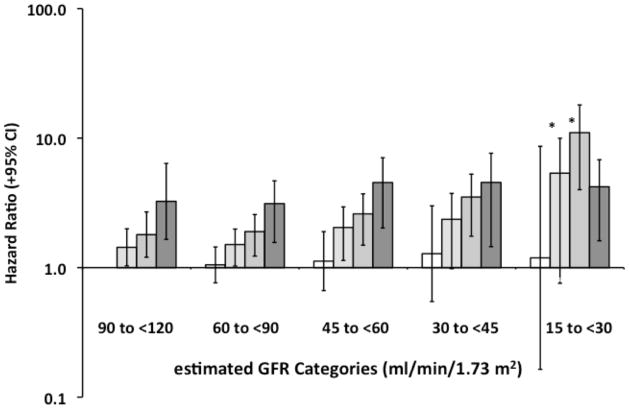
Figure 5. Hazard Ratios for All-Cause Mortality Among 17,393REGARDS Participants: Stratified by Urinary Albumin/Creatinine Ratio (ACR) Categories within each estimated Glomerular Filtration Rate (eGFR) category.
The hazard ratios were obtained with Cox’s proportional hazards regression for categorical analysis,23 and were adjusted for age, race, gender, educational status, current smoking status, body mass index, hypertension, time-dependent effect of hypertension, diabetes, dyslipidemia and hemoglobin, as well as interactions between each eGFR and ACR category. Open bars represent the normal ACR category (ACR <10 mg/g), and the darker bars represent high normal, high and very high ACR categories in each eGFR strata. The high normal and high ACR series had significant P values (<0.05) for linear trends when regressed on the median eGFR for each category (*). The linear trend analyses for the normal and very high ACR categories were not significant (P value >0.4).

