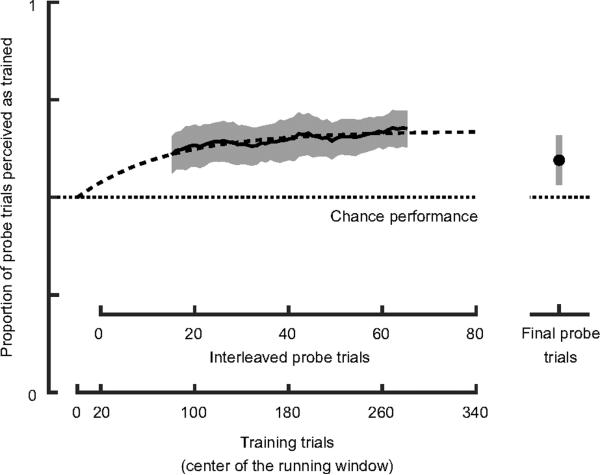
Figure 3.
Proportion of probe trials perceived consistent with the contingency during exposure, indicating recruitment of EVM. Data for probe trials interleaved with training trials are shown. We used a running window of 30 probe trials to filter the data. Error bars represent 95% confidence intervals across participants calculated separately for each datapoint of the running average (see Supplemental Experimental Procedures). See also Figure S2 for further data analysis and Figure S3 for an additional experiment that investigates the buildup of learning over multiple days and the decay of the effect in the final probe trials.

