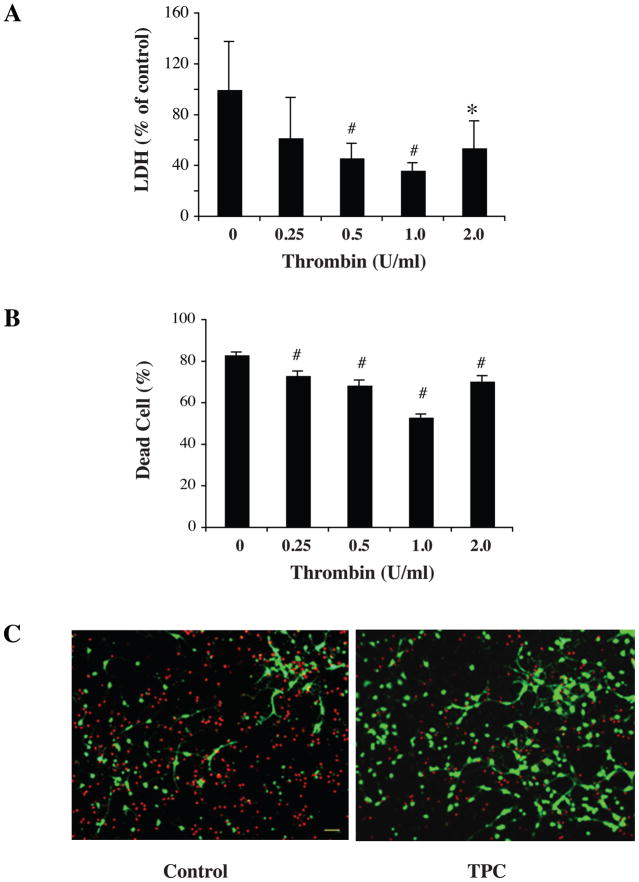
Figure 1.
Primary cultured neurons were pretreated with different doses of thrombin for 24 hours and then exposed to oxygen glucose deprivation (OGD) for 2 hours. The levels of lactate dehydrogenase (LDH) released into the medium (A) and the percent of dead cells by live/dead cell staining (B and C) were measured after 22 hours of reoxygenation. Values are expressed as means ± SD. *p< 0.05, # p< 0.01 vs. control (0 U/ml thrombin). In (C), neurons stained red indicate dead neurons and those green are live. TPC = thrombin preconditioning with 1U/ml. Scale bar = 20 μM.

