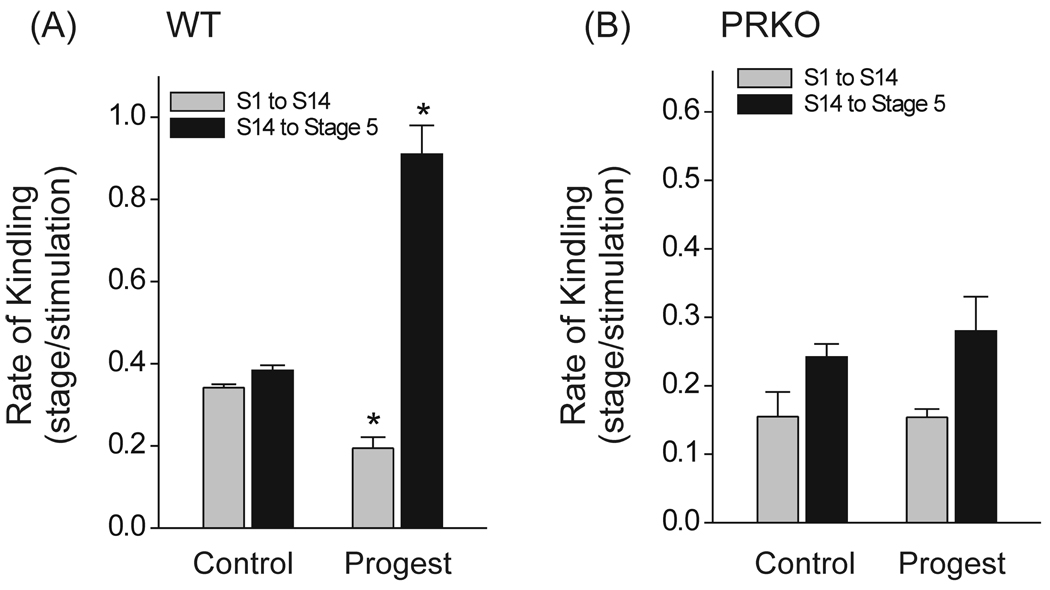
Fig.5. Comparison of the rate of kindling development during P-treatment and P-free periods in WT and PRKO mice.
Mean seizure stage values with stimulations 1 through 14 or stimulation 14 through stage 5 kindling (Fig. 3A and 3C) were fit to the linear function Sn=Rn+A, where Sn is the mean seizure stage value for the nth stimulation, R is the rate of kindling, and A is set equal to either 0 (stimulations 1 through 14) or S14 (stimulations 14 to stage 5 kindling). Correlation coefficients (r) were >0.95 for WT groups. Values represent the mean ± SEM. *p<0.01 vs. control group.

