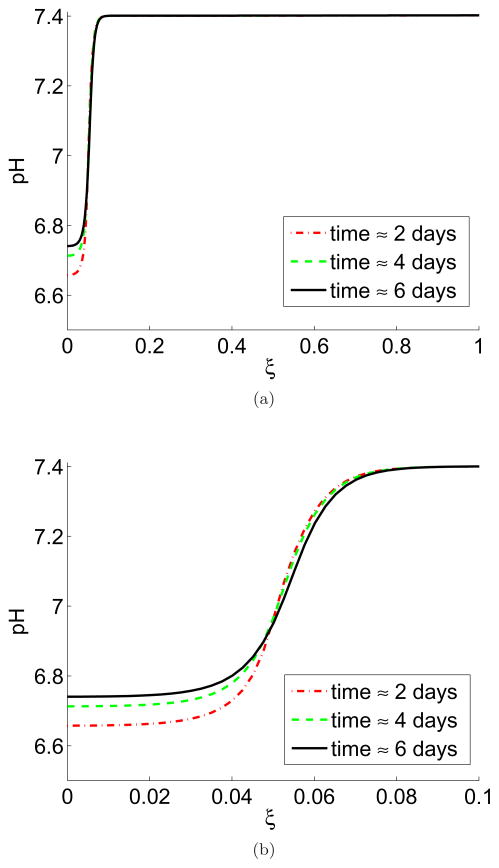
Figure 3.
In colour online. Tumour/tissue pH gradient from interior of the tumour into the peritumoural tissue with no vessel leakiness, shown at 2 days (red dash), 4 days (green dash/dot), and 6 days (black line). Figure (a) shows the whole domain (≈15 mm) and (b) zoomed-in version of (a) on the length scale of the window chamber imaging (≈1.5 mm). Note the expected gradient of acidity from the interior of the tumour (low pH at around 6.7) to normal levels in the peritumoural tissue (normal pH at 7.4). Also note the slight increase in pH inside the tumour over the course of the simulation, which corresponds to the results seen in Figure 1. Simulations are of Equations (5)–(8) with parameters as in Table 1, ν = ν1. The pH is calculated from the excess interstitial tumour/tissue H+ ions, ΛT and with a baseline pH of 7.4. Each unit of ξ corresponds to ≈15mm.

