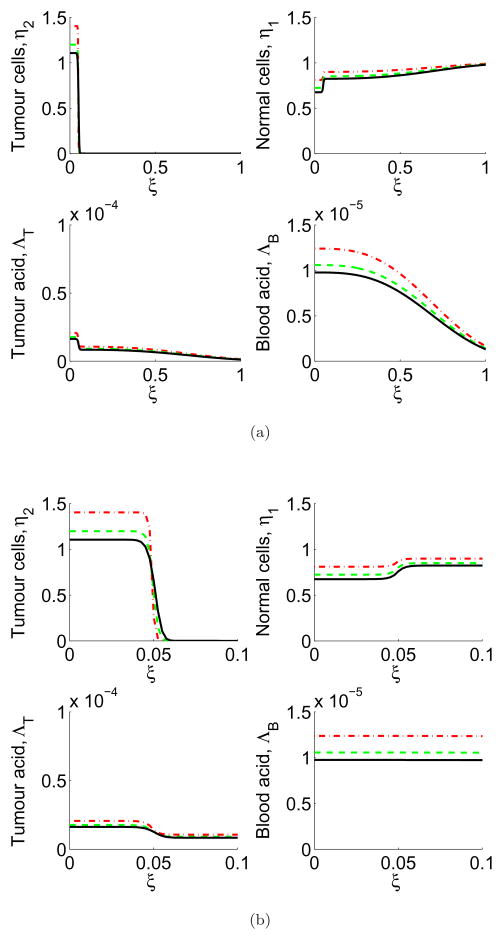
Figure 4.
In colour online. (a) Full domain (≈15 mm) and (b) zoomed-in (≈1.5 mm, the scale of the window chamber) simulations of the effect of leaky vasculature on tumour cell (top left), normal cell (top right), tumour excess H+ ion (bottom left) and blood excess H+ ion (bottom right) profiles over the course of the simulation. The profiles are shown at 2 days (red dash), 4 days (green dash/dot), and 6 days (black line). The vessel leakiness increases the blood acid levels, and decreases the tumour acid. Simulations are of Equations (5)–(8) with parameters as in Table 1, ν = ν2. Each unit of ξ corresponds to ≈15mm.

