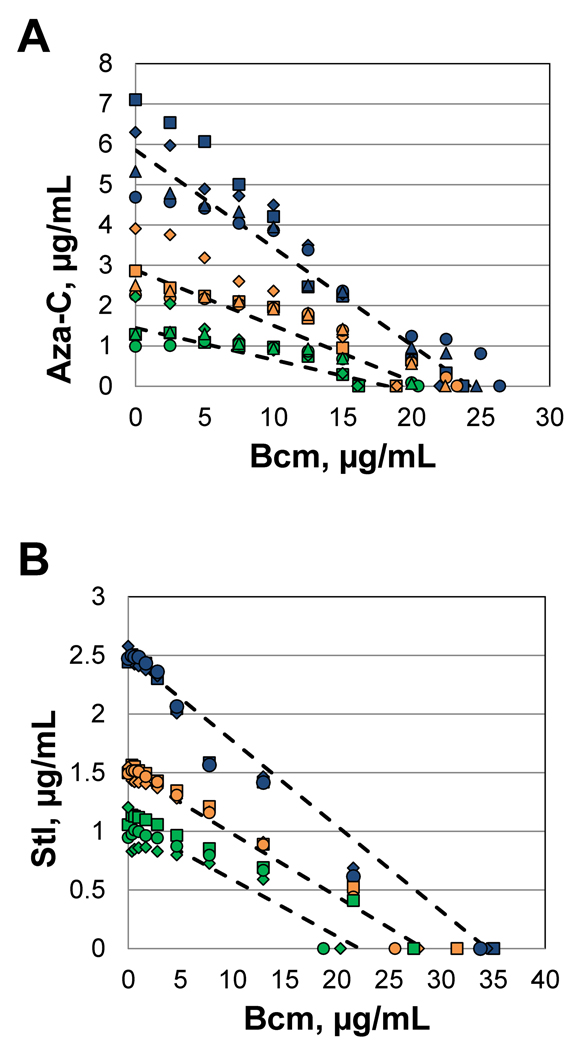
Figure 8. Isobolic test for synergy with Rho inhibitor bicyclomycin.
Growth curves were measured in each well of a 96-well microtiter plate, with varying concentrations of bicyclomycin (right to left) and either aza-C or streptolydigin (top to bottom). The strain for the bicyclomycin/aza-C experiment was HK22 pBAD-MEcoRII, while the strain for the bicyclomycin/streptolydigin experiment was EW1B. A detailed description of the data analysis and processing are presented in the Supplemental Material. Briefly, at each concentration of bicyclomycin (Bcm), the concentration of aza-C (panel A) or streptolydigin (Stl; panel B) necessary to inhibit growth by 95% (blue), 75% (gold) or 50% (green) was estimated. In addition, the concentration of bicyclomycin necessary for those levels of growth inhibition (in the absence of the second drug) was estimated from the bicyclomycin inhibition curve. The data from each of 4 (panel A) or 3 (panel B) repetitions (on different days) were plotted with different symbols (squares, diamonds, circles and triangles). The dashed lines connect the average determined MIC value of each drug alone.

