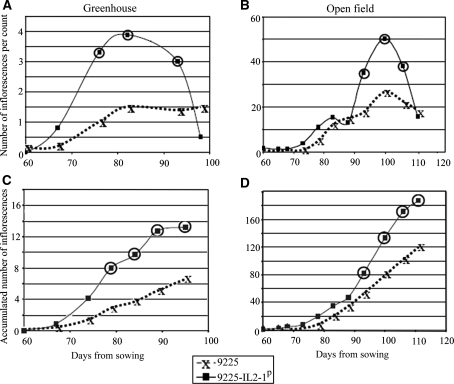
Fig. 3.
The effect of the IL2-1 introgression on flowering pattern at the 9,225 genetic background. The numbers of inflorescence per count are presented from two different experiments: greenhouse and open field. Each point represents the mean value of 10 plants. Means of the nearly isogenic lines were compared on each counting point using t test. Mean values of 9225-IL2-1p that were found significantly different from their nearly isogenic control (at P < 0.05) are circled

