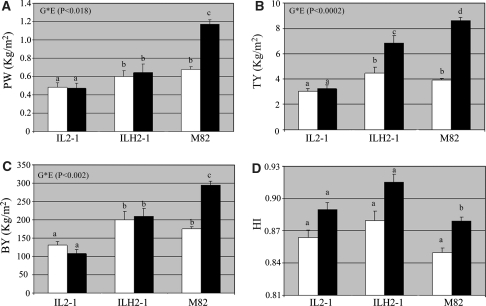
Fig. 5.
Phenotypic values for total fruit yield (TY), plant vegetative weight (PW), Brix yield (BY) and harvest index (HI) on the dry and wet fields. Mean values ± SE for IL2-1, ILH2-1 and M82 are presented. Black bars represent values from the irrigated field. Empty bars are the dry field values. P value for the genotype × environment interaction (G × E) is presented for each trait. Values indicated with different letters were determined significantly different by ANOVA. Black bars wet conditions and white bars dry conditions

