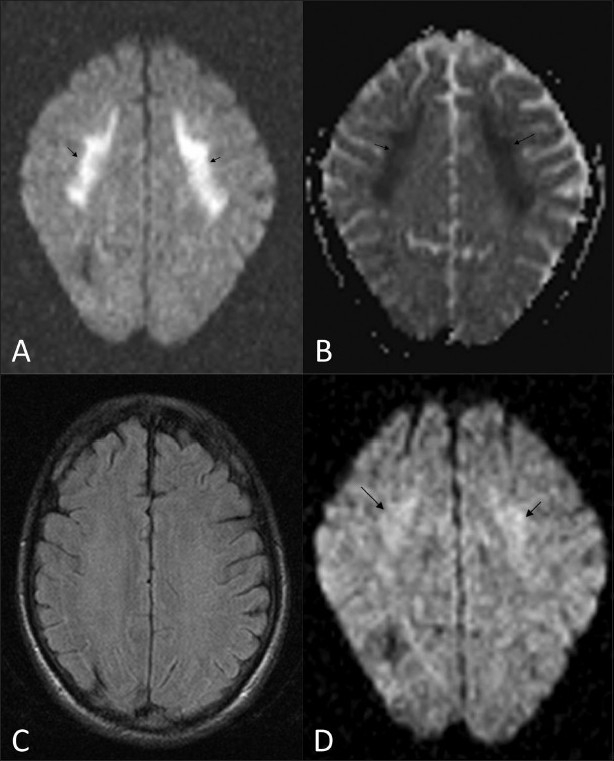
Figure 2 (A-D).

MRI. Axial diffusion-weighted (b1000) image (A) shows significant restriction of diffusion (arrows) in the frontal lobe white matter and the splenium of the corpus callosum (not shown). Corresponding ADC image (B) shows decreased ADC, as evident by the dark signal (arrows) in the region of reduced diffusion (ADC: 350 – 400 10-3 mm2/s). Axial FLAIR image (C) shows no significant changes in the region of reduced diffusion. Follow-up MRI (diffusionweighted imaging) (D) shows resolution of the white matter changes (ADC: 650 – 700 10-3 mm2/s)
