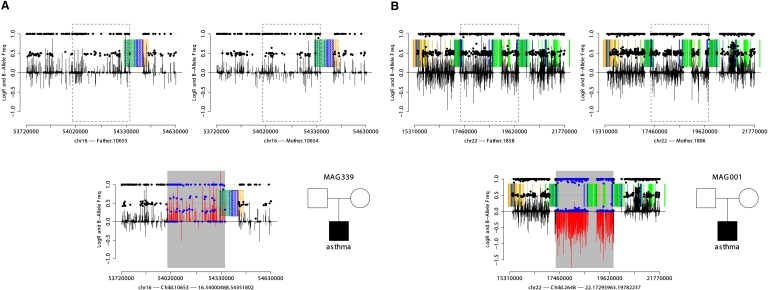
Figure 1.
An example of de novo duplication (A) and deletion (B) detected by SNP array data. SNP array data from the father, mother, and child are displayed as shown in the pedigree in the lower-right portion of each panel. Each plot shows LogR Ratio (vertical bars), B-allele frequency (solid points), intrachromosomal segmental duplications in direct orientation (green blocks), inverted orientation (blue blocks), and interchromosomal segmental duplications (orange blocks). CNVs are highlighted by gray rectangles, contrasting the LogR ratio (red) and B-allele frequency (blue) with flanking regions (black). The de novo duplication (A) is characterized by an increase in the LogR ratio and altered clustering of heterozygote B-allele frequencies not seen in either parent. The de novo deletion (B) displays a decreased LogR ratio and loss of heterozygosity not observed in either parent.

