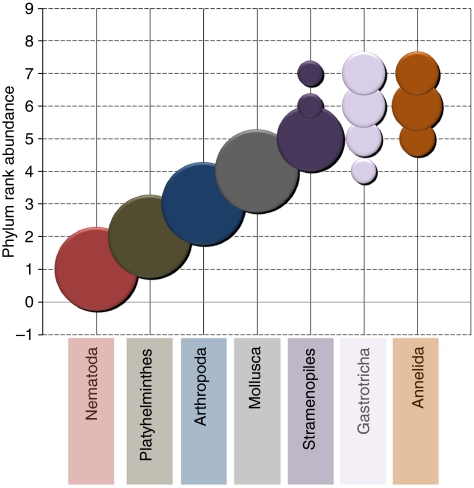
Figure 3. Phylum rank abundance plot.
Community assemblage OCTU richness rank order for the main phyla recovered from the Prestwick and Littlehampton samples (after data standardization). The frequency of ranking (out of the nine samples) is represented by the diameter of the symbol at each rank. Single symbols per phylum represent a constant ranking, whereas multiple symbols highlight variance in phylum rank order throughout the samples.

