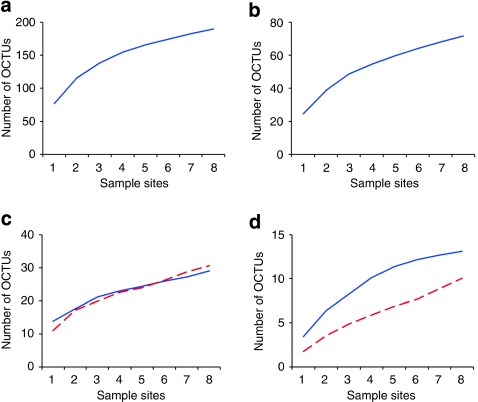
Figure 5. Rarefaction curves of the abundance-based coverage estimation (ACE) diversity estimator.
Plots are shown for (a) Nematoda, (b) Platyhelminthes, (c) Arthropoda (blue) and Mollusca (red dashed), (d) Stramenopiles (blue) and Annelida (dashed red) at 96% identity OCTU cut-off for the Prestwick meiobenthic samples 1–8. Curves were estimated from 100 randomizations, without replacement, using EstimateS, version 8.2.0.

