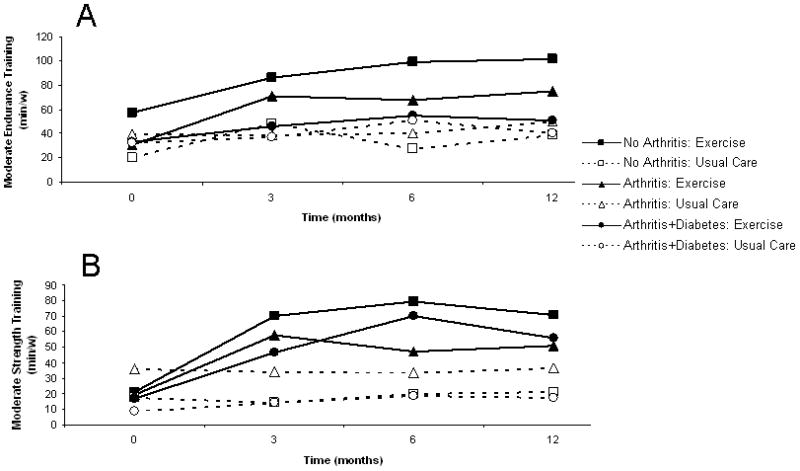
Figure 2.

Trajectories of reported PA per week. Complete lines and closed figures are used to depict trajectories for those assigned to the counseling intervention, and dashed lines and open figures represent those who received usual care alone. Squares indicate those with no arthritis. Triangles are used to represent persons with arthritis with no diabetes. Circles indicate those with both arthritis and diabetes.
A. Minutes of reported endurance training PA per week. Time effects for PA counseling P=0.0006 and for usual care P=0.17.
B. Minutes of reported strength training PA per week.
Time effects for PA counseling P<0.0001 and for usual care P=0.51.
